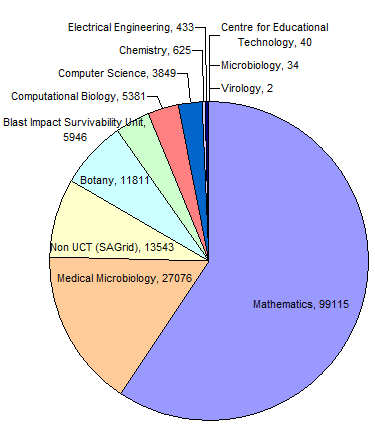
Below is a graph of the CPU hours consumed to date on all of our clusters. We've broken down the usage per department or research group.
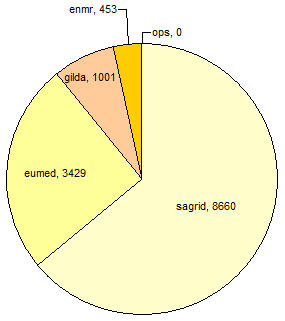
 Below is a breakdown of the SAGrid CPU 13,543 hours performed on the ZA-UCT-ICTS grid cluster. This also includes work done by researchers outside of South Africa in the EuropeanMediterranean area.
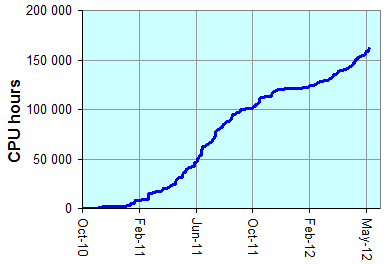
 Below is the increase in CPU hours consumed for all ICTS clusters since we implemented our first production Grid cluster in late 2010. The accelerated rate of increase in early 2011 is from the addition of the ICTS HPC cluster and its adoption by UCT researchers:
 The DecemberJanuary break is clearly evident but once again we're accelerating into 2012.
 Below is a breakdown of the SAGrid CPU 13,543 hours performed on the ZA-UCT-ICTS grid cluster. This also includes work done by researchers outside of South Africa in the EuropeanMediterranean area.
 Below is the increase in CPU hours consumed for all ICTS clusters since we implemented our first production Grid cluster in late 2010. The accelerated rate of increase in early 2011 is from the addition of the ICTS HPC cluster and its adoption by UCT researchers:
 The DecemberJanuary break is clearly evident but once again we're accelerating into 2012.