There are several ways to interrogate the cluster to view its general status. There are command line tools such as qstat, cores and sinfo, however those are all text based. The dashboard provides a single visual interface that allows one to scan every single core on the cluster at a glance to determine how busy it is. The only drawback is that this view looks a bit like an explosion in a pixel factory, so some interpretation is needed.
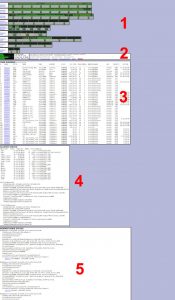
Below is a high-level view of the dashboard page. It is split into 5 sections:
1 – Nodes
2 – General
3 – Jobs
4 – Cluster status
5 – Worker node status
1 – Nodes
This very busy graphical view of the cluster shows all of the nodes and cores against their partitions. Each block is a worker node (server). Each vertical bar is a core with the last vertical bar being the RAM:
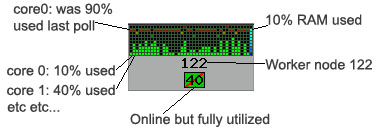
Left is an example of a typical worker node in use. All 40 cores are reserved. The processes running on this are “bursty”, right now they are only engaging the cores at about 40% on average, however during the previous polling cycle the load average was about 90%. The RAM bar graph shows the amount of RAM remaining, 90%.
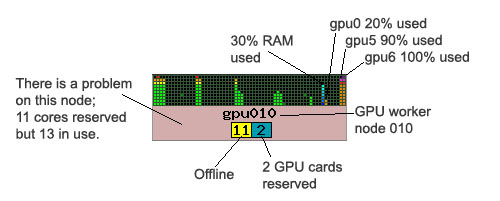
Right is an example of a GPU node that is registering a problem. The node background is faded red to indicate an issue, in this case more cores and GPU cards are in use than have been reserved. The administrator has placed this node into draining mode while the issue is dealt with. This is typical of a job that has not terminated correctly.
 This node is marked as ‘down’ as it is powered off, the SLURM daemon is not running or it is not reachable on the network.
 This node’s cores and memory graphs are faded to indicate that it has probably crashed, is no longer reporting core and memory values, however when the head node last got data from it these were the values it reported.
 This section shows the general health of the cluster and contains links to various pages with more detailed information. On the left is a bar graph indicating the remaining space on the shared disks.
On the right are the logged in users, the CPU load on the head node as well as the available RAM. Below this is the number of CPU hours currently being computed as well as the number of jobs running and on the queue.
3 – Jobs
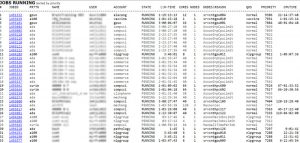 This section shows the jobs that are running or queued. The Q\R-TIME column indicates how long jobs have been running for or have been queued for. Queued jobs are shown in grey. The CPUTIME column is the product of the TIME column and the reserved CORES column. The list is sorted by priority.
The longer a job remains queued the higher its priority and the greater the chance of it running. There are many reasons why a job might be queued, below are some of the more common ones:
Resources - There are insufficient free cores\nodes to run your job.
AssocGrpCpuLimit - You have reached your core limit, your currently running jobs need to end first.
AssocMaxJobsLimit - You have reached your job limit, your currently running jobs need to end first. This is normally applied to a group of users which means that other users jobs in the group count against your limit.
MaxWallTimePerJob - You have specified a wall time in excess of the limit for your account or the partition.
Priority - Your job could run but another job which has been waiting longer has priority over the resources.
4 – Cluster status
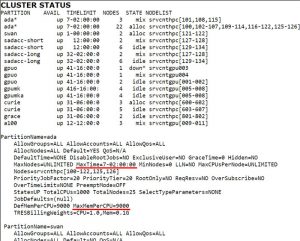
This section shows the default partition limits and the state of the nodes in those partitions. Of importance here is the default wall time as well as the maximum memory per CPU. The partitions are listed multiple times as there are nodes listed in a variety of states.
5 – Worker node status
This section shows the current state of the worker nodes as well as the jobs running on them.
In the case of a GPU node the resource section will include the available GPU instances.

